Heatmap-Driven CTA Placement
Use behavioral data to place CTAs where buying intent peaks.
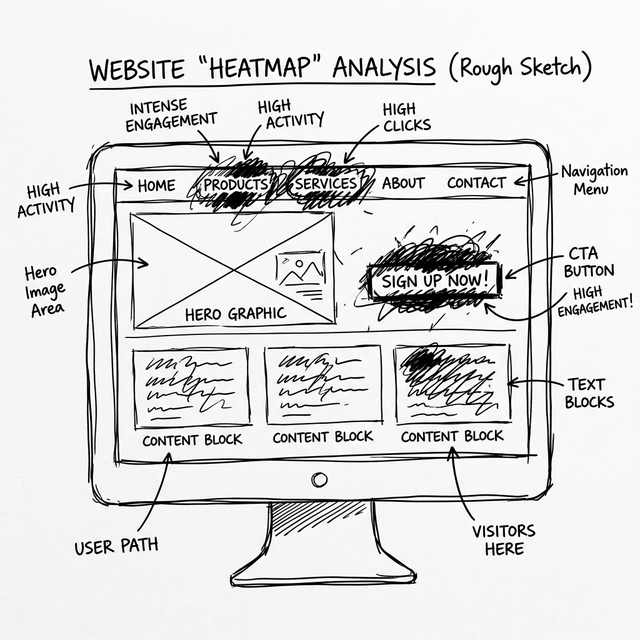
CTA placement should follow behavior data, not design preference. Heatmaps and session recordings show where users hesitate, rage-click, or bounce before taking action, and those moments reveal your real conversion opportunities. Move primary CTAs into high-attention zones, then support them with confidence copy and proof snippets right before the click. In many service funnels, this alone can lift form-start rates without increasing traffic or ad spend.
Small clarity gains can produce large performance lifts. A useful operating model is to pair behavioral data with weekly experiments, then promote winners into your default templates. This compounds conversion rate over time. When teams focus on buyer intent and trust signals, conversion growth becomes repeatable instead of random.
Conversion growth happens when uncertainty is removed at each decision point. Prospects need clear outcomes, believable proof, and obvious next steps. If those elements are weak, even high traffic volume underperforms. Start by mapping the top objections on each page and adding specific trust and clarity elements where hesitation occurs.
Testing should be run as a sequence of focused experiments, not broad redesign bursts. Prioritize high-impact variables like value framing, CTA context, and friction around first action. Measure both volume and quality outcomes so gains are commercially meaningful. A lift in submissions is not useful if close rate deteriorates.
Behavioral data is your guide to where conversion breaks. Session recordings, scroll patterns, and abandonment points reveal where users lose confidence. Pair those observations with targeted copy and layout changes so each iteration solves a specific problem. This approach produces steady progress and reduces wasted design cycles.